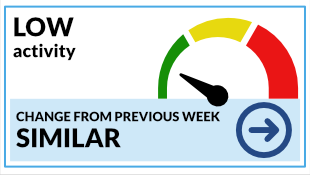
How much respiratory illness do we have locally right now?
Use the activity levels below, to learn how much respiratory illness is in our community right now. This can help guide you in making decisions to keep yourself and others healthy.1
COVID
|
 |
FLU
|
|
Updated April 23, 2024
To reduce your risk of catching or spreading respiratory illness, you can:
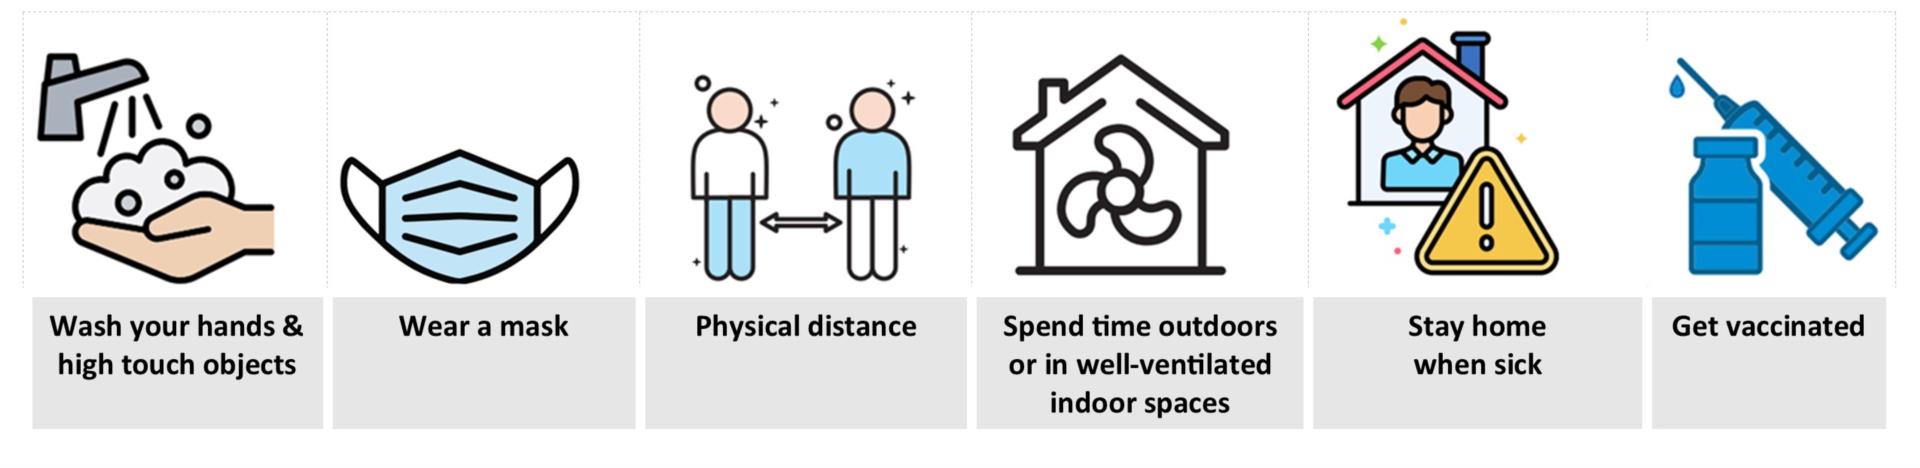
For more detailed tips see Public Health Ontario’s ‘How to protect yourself and others from respiratory viruses’.
Infectious respiratory illnesses are caused by germs such as viruses or bacteria that can easily be spread to others. Examples are the flu, COVID-19, and the common cold. Symptoms can include cough, fever, sore throat, runny nose, shortness of breath, muscle aches, fatigue, vomiting/diarrhea, or abdominal pain.
Each fall and winter, many different types of respiratory viruses circulate in our community. These viruses can spread through the air when people infected with a virus cough, sneeze, or talk closely with another person. Viruses can also spread by touching an infected object and then touching your mouth, nose, or eyes.
The number of cases below is less than the actual number of people with illnesses in the community because not everyone gets tested. Since 2022, testing (PCR, IDNow) is only done in high-risk settings (such as hospitals or Long-Term Care Homes).
The data on this page are updated with the most recent information available each week.
The last update was April 23, 2024.
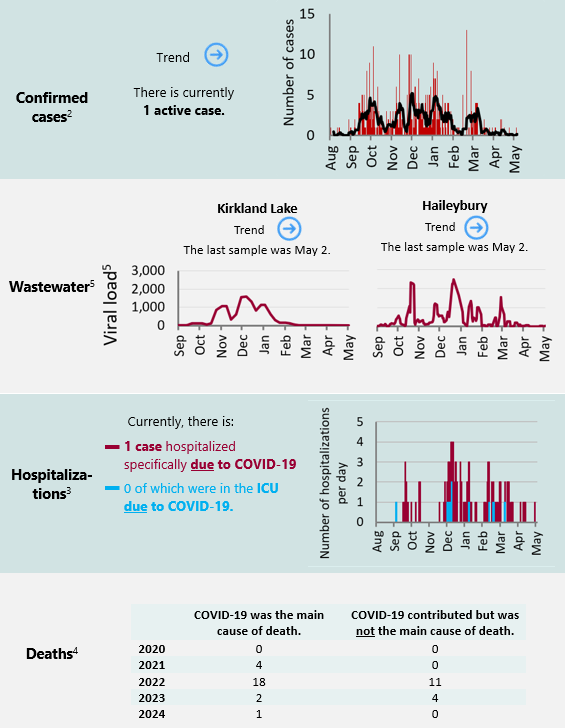
COVID-192,3,4
|
Active cases
2
|
2024 deaths
1
|
Hospitalizations with COVID
0
|
Hospitalizations due to COVID
0
|
|
Total cases
3,676
|
Total deaths
40
|
ICU admissions due to COVID
0
|
|
Outbreaks: Hospitals, Long-Term
Care Homes, or other congregate care3
Northdale Manor
|
Influenza
Since September 2023, there have been 36 cases of influenza A in Timiskaming, and 2 recent cases of influenza B. Interpret this with caution because laboratory testing is limited. The number of influenza cases is decreasing in Timiskaming, Northeastern Ontario and the entire province.6 Additionally, wastewater analysis in Kirkland Lake and Haileybury detected very low levels of influenza A, which suggest that influenza is likely circulating at low levels in our community.5
What is influenza?
Influenza, commonly known as the flu, is a contagious respiratory illness caused by influenza viruses. The flu can result in a range of symptoms, including fever, cough, sore throat, body aches, fatigue, and more. It can lead to mild to severe illness and, in some cases, can be fatal. Influenza viruses are highly contagious. These viruses can spread through the air when people infected with the virus cough, sneeze, or talk closely with another person. Influenza can also spread by touching an infected object and then touching your mouth, nose, or eyes.
RSV/Other Viruses
Low levels of the following viruses have been detected in Timiskaming since September of 2023:
- RSV
- Parainfluenza
- Rhinovirus
Interpret this with caution because laboratory testing is limited.
What is RSV and other viruses?
The descriptions below are just a general overview. How sick someone gets can be different for each person. Some might only have mild symptoms, while others could get more severe symptoms, and sadly, in some cases, it can even lead to death.
Adenoviruses cause a range of illnesses, including respiratory and gastrointestinal infections. Symptoms may include fever, cough, and sore throat.
Enteroviruses and rhinoviruses commonly cause mild respiratory and gastrointestinal infections. Rhinoviruses are a frequent cause of the common cold, leading to symptoms like runny nose and congestion.
Human metapneumovirus (HMPV) is a respiratory virus that can cause infections, especially in children and older adults. Symptoms may include cough, fever, and difficulty breathing.
Parainfluenza viruses cause respiratory infections, such as croup and bronchiolitis, particularly in young children. Symptoms may include cough, fever, and a barking cough in the case of croup.
RSV stands for Respiratory Syncytial Virus. It is a common virus that can cause cold-like symptoms. RSV is a common virus affecting the respiratory tract, causing illnesses like bronchiolitis and pneumonia, especially in infants and young children.
Coronaviruses (other than COVID-19) are a family of viruses causing respiratory infections. Some strains, like the common cold coronaviruses, result in mild symptoms. Others, such as those causing SARS and MERS, can lead to severe respiratory illnesses.
Methods and sources
1. Respiratory activity levels and trends are based on the number of cases in the last week, the wastewater viral load, the percent positivity, and the number of local outbreaks in high-risk settings
2. The number of cases underestimates the actual number of people infected with the virus in the community because since 2022, testing (PCR, IDNow) is only done in high-risk settings (like hospitals or Long-Term Care Homes).
Source: Ontario Ministry of Health, Public Health Case and Contact Management System, Timiskaming Health Unit.
3. Hospitalization data provides information about the impact of respiratory viruses on the healthcare system in Timiskaming. Patients who are in the hospital while waiting to be transferred to long-term care are not included, except during a hospital outbreak. An intensive care unit (ICU) is a hospital department that provides intensive care to critically ill patients. Timiskaming’s ICUs are classified as level 2. Patients with specialized or more critical needs are transferred to a non-local, larger hospital with specialized level 3 ICUs. Patients transferred out of Timiskaming for care are not included in this total.
Source: Ministry of Ontario, Capacity Planning and Analytics Division, Visual Analytics Hub – Bed Census summary, and data provided by local hospitals.
4. Deaths were not considered a contributing cause of death when there was a clear alternative cause, such as trauma, drug toxicity, or other natural death processes.
Source: Ontario Ministry of Health, Public Health Case and Contact Management System, Timiskaming Health Unit.
5. The wastewater project is run through a partnership between the municipalities of Kirkland Lake and Temiskaming Shores, the Ontario Clean Water Agency, the Government of Ontario, the Public Health Agency of Canada, Health Sciences North Research Institute, and the Timiskaming Health Unit. The program is funded through the Ontario Ministry of the Environment, Conservation and Parks. For more information, visit the Ontario government’s COVID-19 wastewater monitoring webpage.
The viral load is the amount of virus found in the water, it is the 3 sample average mean of COVID-19 virus copies per millilitre. The viral load is biomarker and flow normalized, multiplied by 10 billion for ease of interpretation, and adjusted to represent the number of people in the sewershed.
6. Ontario Agency for Health Protection and Promotion (Public Health Ontario). Ontario respiratory virus tool. Toronto, ON. https://www.publichealthontario.ca/en/Data-and-Analysis/Infectious-Disease/Respiratory-Virus-Tool
Additional respiratory illness data for Ontario can be found on Public Health Ontario’s Respiratory Virus Tool.
20240423/cb:nd