Opioid Surveillance Dashboard
Timiskaming Health Unit (THU) publishes opioid surveillance information to help inform members of our community about the current opioid situation in Timiskaming. The purpose of the opioid surveillance dashboard is to provide access to timely and accurate information on acute care system utilization, naloxone distribution and the overall impact of opioid use in our communities.
General Notes :
- The opioid surveillance dashboard will be updated monthly. Some indicators, such as demographic data, are updated quarterly. Details are provided under each section.
- Data on the previous and current year are preliminary and subject to change.
- Suspected drug-related deaths include deaths where the preliminary investigation by the investigating coroner indicated drugs were found at the scene, or drug paraphernalia at the scene, history of drug use, naloxone use, or physical sign of drug use or preliminary findings from autopsy indicate a suspected drug intoxication.
- Confirmed opioid-related deaths are deaths for which a coroner or forensic pathologist determined the cause of death to be drug toxicity with opioid involvement. Conclusions on cause of death may take several months to become available.
- On this page, reference to Timiskaming means the Timiskaming Health Unit area, which includes the District of Timiskaming and the Municipality of Temagami.
- Questions about this information? Please contact: harm.reduction@timiskaminghu.com
Data notes/caveats:
- Some of these data are presented as rates per 100,000 population. That means that out of 100,000 people in the relevant age, sex, and geographic category over the 2-year period, you would see “x” number of opioid-related cases. This is a common way of presenting data as it allows for the comparison of different groups, even if they have different population sizes. It is important to note that Timiskaming does not have 100,000 or more people, so the number of cases observed are lower than the rates presented in Timiskaming.
- In some instances, the number of cases related to opioid-related ED (Emergency Department) visits and deaths over the 2-year period are small; therefore, some of the rates presented are quite low and fluctuate during different time periods. As a result, rates must be interpreted cautiously.
- Rates shown by quarter have been “annualized.” They represent the annual rate that would be seen if the rate within that quarter persisted for an entire year.
- Compare Timiskaming and Ontario ED and hospitalization rates carefully as differences in health service delivery most likely influence the rates. For instance, Timiskaming residents may be more likely to visit the emergency department than a person in an urban center who may have access to other medical services such as walk-in clinics.
Suspected opioid-related incidents in Timiskaming
Updated monthly* (The last update was on April 10, 2025)
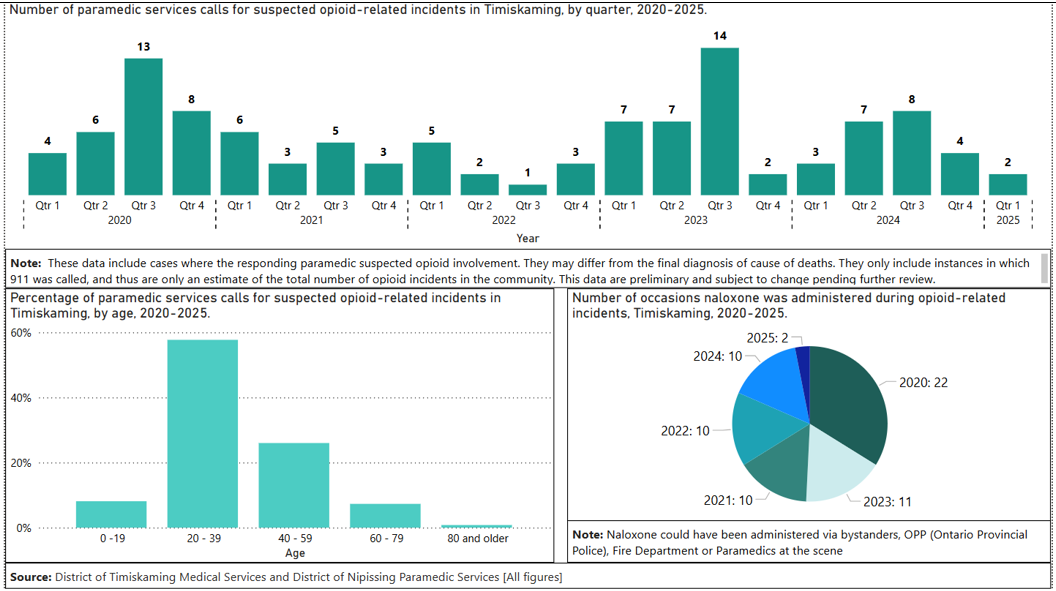
- In Jan 2025, there were 2 paramedic services calls for suspected opioid-related incidents which is the same as the number reported in Jan 2024.
- In 2024, paramedic services responded to 22 suspected opioid-related incidents which is lower than the 30 calls responded to in 2023.
- From 2020-2024, the number of emergency medical services (EMS) calls for suspected opioid-related incidents have been decreasing with some fluctuations in between; the greatest spike was seen in 2020 followed closely by 2023.
- From 2020-2024, there were 111 paramedic service calls for suspected opioid-related incidents, with the greatest percentage of calls among those 20-39 years of age (56.4%).
- From 2020-2024, 63 doses of naloxone (Narcan) were administered for opioid-related incidents when paramedic services were called in Timiskaming.
Emergency Department (ED) Visits
Updated monthly (excluding demographic data) (The last update was on April 10, 2025)
Please refer to data notes section above for interpretation and comparison of rates.
Confirmed opioid incidents in Timiskaming
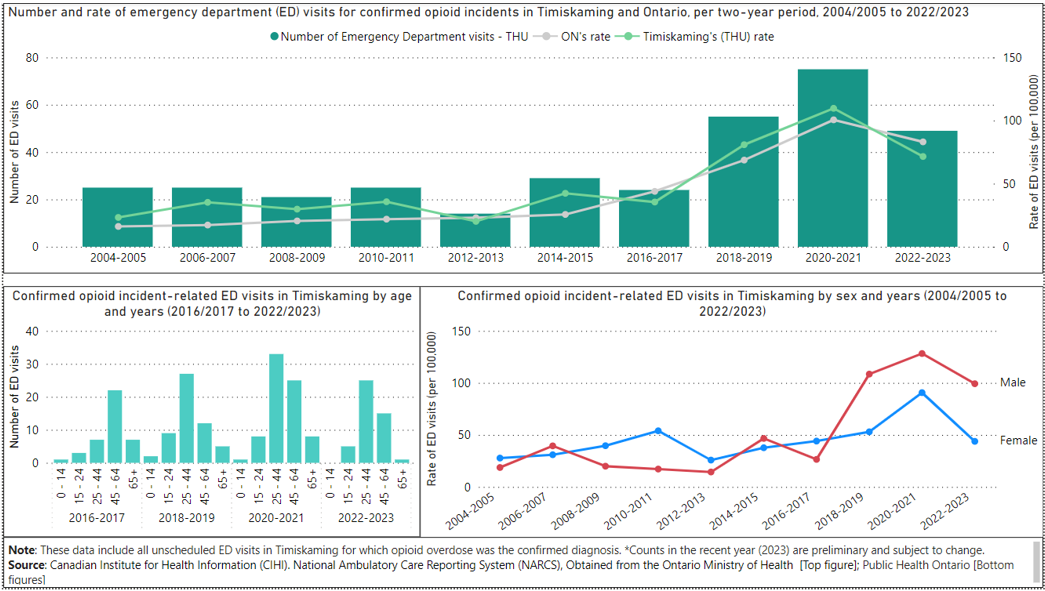
- From Jan-Mar 2025, there have been 0 ED visits for opioid incidents. This represents a local annualized rate of 0 visits per 100,000 population, which is statistically lower than Ontario's rate of 32.1 visits per 100,000 population.
- In 2024, there were 18 ED visits for opioid incidents. This represents a local rate of 52.5 visits per 100,000 population per year, which is not statistically different from Ontario's rate of 76.2 visits per 100,000 population per year.
- In 2023 (total), there were 29 reported ED visits for opioid incidents; this represents a local rate of 84.6 visits per 100,000 population, which is not statistically different than Ontario’s rate of 84.2 visits per 100,000 population.
- In 2022 (total), there were 20 reported ED visits for opioid incidents; this represents a local rate of 60.9 visits per 100,000 population per year, which is statistically lower than Ontario’s rate of 80.7 visits per 100,000 population per year.
- Since 2016, the rate of ED visits for opioid incidents has been significantly increasing in Timiskaming and Ontario, with the greatest spikes observed in 2020/21.
- From 2018-2019 to 2020-2021, both males and females in Timiskaming reported an increase in ED visits for opioid incidents followed by a decrease in 2022-2023. Since 2018-2019 to 2022-2023, the number of ED visits in Timiskaming has been greater in those aged 25-44 followed by those aged 45-64.
Hospitalizations for opioid incidents in Timiskaming
This section provides a summary of local hospitalization data in Timiskaming. However, hospitalization data is not shown in the dashboard due to the lack of availability of timely data.
- In Quarter 1 to 3 of 2024, there were 5 hospitalizations reported for opioid incidents. This represents a local annualized rate of 23.4 hospitalizations per 100,000 population, which is not statistically different from Ontario’s rate of 19.5 visits per 100,000 population for the same period.
- In 2023, there were 10 hospitalizations reported for opioid incidents. This represents a local annualized rate of 29.2 hospitalizations per 100,000 population, which is not statistically different from Ontario’s rate of 14.4 visits per 100,000 population for the same period.
- In 2022, there were 12 hospitalizations reported for opioid incidents. This represents a local rate of 36.6 hospitalizations per 100,000 population per year, which was statistically higher from Ontario’s rate of 13.5 hospitalizations per 100,000 population per year for the same period.
- In 2021 (total), there were 17 hospitalizations reported for opioid incidents. This represents a local rate of 52.5 hospitalizations per 100,000 population per year, which is statistically greater than Ontario’s rate of 17.2 hospitalizations per 100,000 population per year for the same period.
- From 2019-2022, the increase in male and female hospitalizations for opioid incidents was observed most among those 25-44 and 45-64 years of age. No statistical differences were observed between males and females.
Deaths
Updated quarterly. (The last update was on April 10, 2025)
Please refer to data notes section above for interpretation and comparison of rates
Confirmed opioid-related deaths in Timiskaming
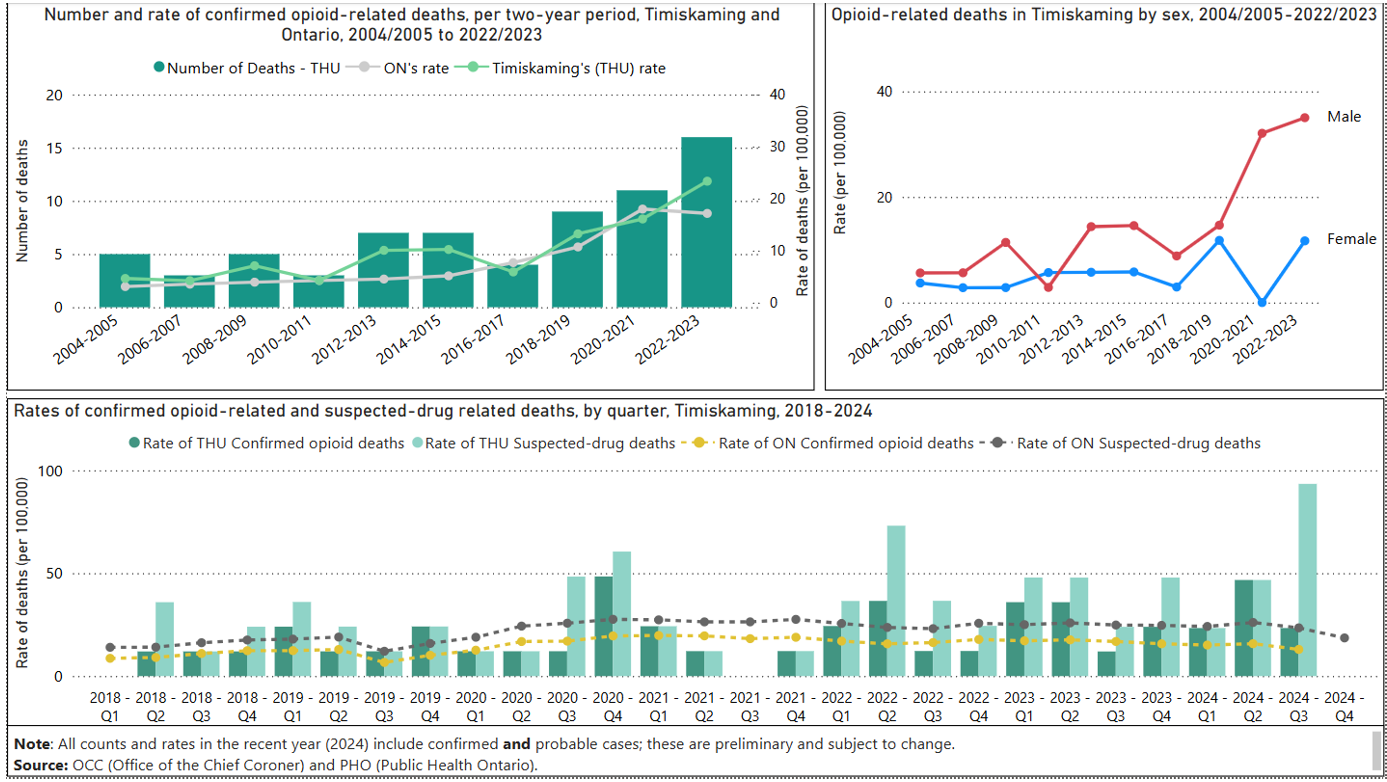
- From Jan-Nov 2024, there were 9 opioid-related deaths reported (confirmed + probable). This represents a local annualized rate of 28.7 deaths per 100,000 population, which was statistically higher than Ontario's rate of 14.6 deaths per 100,000 population.
- In 2023, there were 9 opioid-related deaths reported (confirmed + probable). This represents a local annualized rate of 26.9 deaths per 100,000 population, which was not statistically different from Ontario's rate of 16.8 deaths per 100,000 population per year.
- In 2022, there were 7 opioid-related deaths reported. This represents a local rate of 21.3 deaths per 100,000 population per year, which was not statistically different from Ontario’s rate of 16.3 deaths per 100,000 population per year for the same period.
- In 2021), there were 4 opioid-related deaths reported. This represents a local rate of 12.3 deaths per 100,000 population per year, which was not statistically different from Ontario’s rate of 19.8 deaths per 100,000 population per year for the same period.
- Deaths from opioid incidents have been steadily increasing in Ontario since 2004, with the greatest increase observed in 2020-2021 for Ontario, and 2022-2023 for Timiskaming.
- In the latest data cycle (2020-2023), majority of opioid-related deaths were among males. Due to the small number of cases observed, no data on age groups was shown. No statistical differences were observed between males and females.
Suspected drug-related deaths in Timiskaming
- In Jan-Feb 2025, there were 2 suspected drug-related deaths. This represents an annualized rate of 35.0 deaths per 100,000, which was not statistically different from Ontario’s rate of 16.3 deaths per 100,000 population.
- In 2023 there were 14 suspected drug-related deaths. This represents a local rate of 22.2 deaths per 100,000 population per year, which was not statistically different from Ontario’s rate of 25.2 deaths per 100,000 population.
- In 2022, there were 14 suspected drug-related deaths. This represents a local rate of 42.7 deaths per 100,000 population per year, which is statistically greater than the rate in Ontario of 22.0 deaths per 100,000 population per year.
- In 2021 (total), there were 4 suspected drug-related deaths. This represents a local rate of 12.3 deaths per 100,000 population per year, which is statistically lower than the rate in Ontario of 28.1 deaths per 100,000 population per year.
Naloxone Distribution in Timiskaming
Updated quarterly (pharmacy data) (The last update was on April 10, 2025)
Data excludes naloxone distributed by OPP (Ontario Provincial Police), EMS & Fire Department
Naloxone (also known as Narcan®) is a medication that can temporarily reverse the effects of an opioid overdose. You do not need a prescription or an Ontario health card to get free naloxone kits.
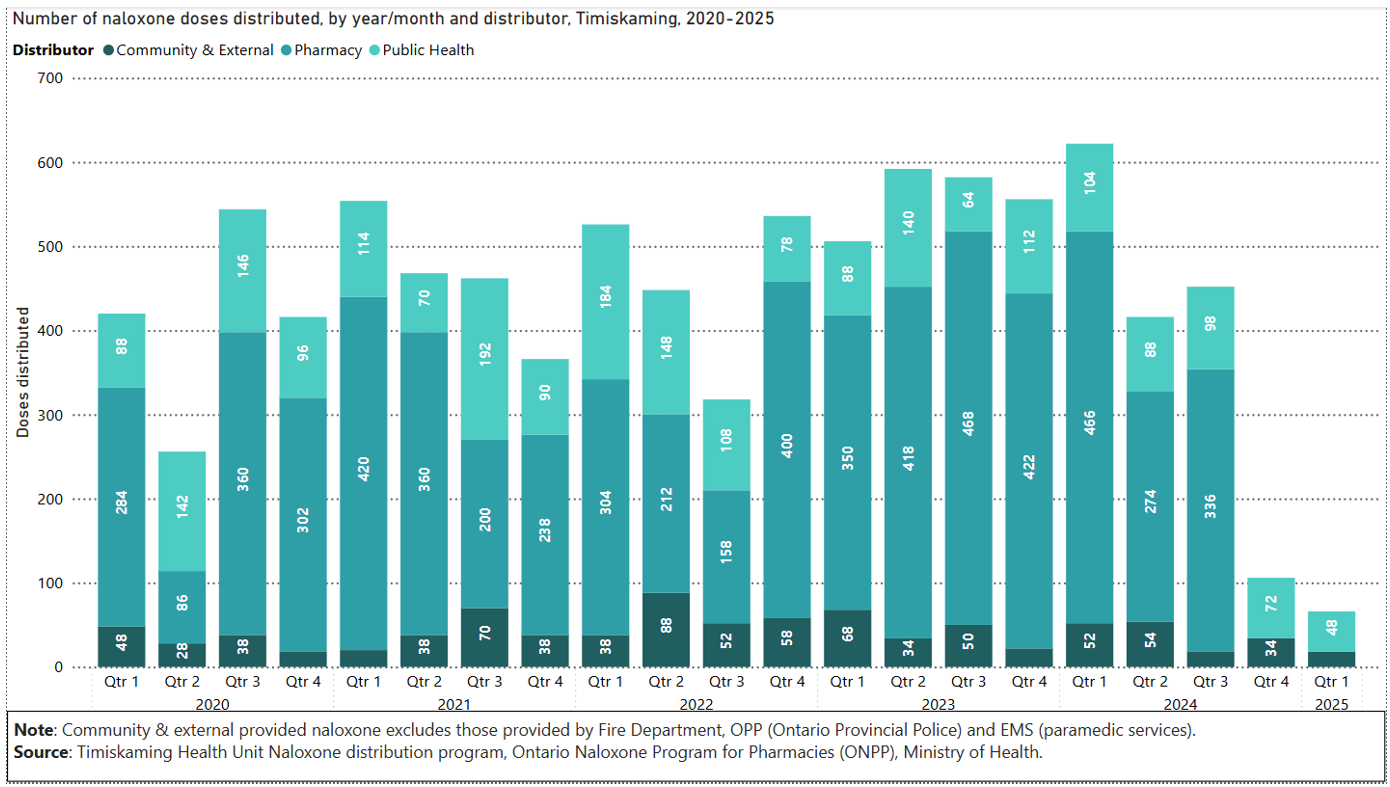
In Timiskaming, naloxone is distributed by pharmacies, THU, and community partners.
- In Jan-Mar 2025, community and external partners distributed 66 doses of naloxone, whereas during the same period in 2024, 156 doses were distributed.
- In 2024, 1,596 doses of naloxone have been reported as being distributed (note: Pharmacy data not available after Sept 2024.
- In 2021, 2022, and 2023, 1,850, 1,828, and 2,236 doses of naloxone were reported as being distributed respectively.
For more information about opiods, please visit here.
Learn more about Canada’s opioid crisis
20250410/ao:tr