What is the current COVID-19 situation in Timiskaming?
On this page:
Current COVID-19 data in Timiskaming1
Notice: The Timiskaming Health Unit is now only showing counts for confirmed cases to align with provincial reporting. This means the numbers below no longer count the 280 probable cases and 1 death).
This data is updated each Tuesday. The last update was December 15, 2023.1,2,3,4
|
Active cases
26
|
2023 deaths
5
|
Hospitalizations with COVID
7
|
Hospitalizations due to COVID
4
|
|
Total cases
3,523
|
Total deaths
38
|
ICU admissions due to COVID
1
|
|
Outbreaks: Hospitals, Long-Term
Care Homes, or other congregate care3
–
|
Additional notes on this table consist of notes 2,3 and 4.
1 Throughout this webpage, ‘Timiskaming’ represents the Timiskaming Health Unit catchment area, which consists of the District of Timiskaming and Temagami.
2 The number of cases underestimates the actual number of people with COVID-19 in the community due to changes in testing eligibility in 2022.
3 An outbreak is defined as two or more COVID-19 cases within a 10-day period, where at least one case was likely acquired within the high-risk setting.
4 Source: Ontario Ministry of Health, Public Health Case and Contact Management Solution (CCM), Timiskaming Health Unit.
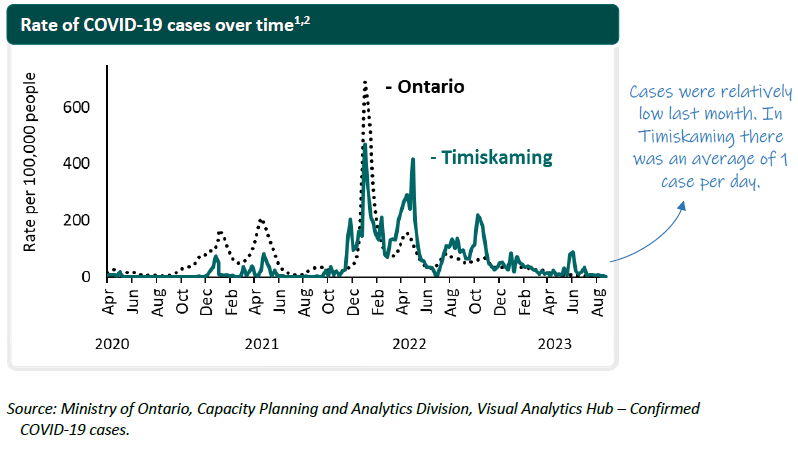
Summary of COVID-19 data in Timiskaming2,4
All the data below is updated monthly. The last update was on October 10, 2023.
Rates are used to compare one population to another, such as in the graph below showing Timiskaming and Ontario’s rates since 2020.
Variants of Concern
All viruses change over time. Some changes can affect how easily they spread, the severity of the illness they cause, how they react to vaccines or medicines, and how they are detected.
Full genome sequencing can identify variants and is conducted on a portion of positive cases in Ontario.
|
The variants detected in
Timiskaming
were
EG.5.1.1 (1 case)
EG.5.1.3 (1 case)
'Other recombinant' (1 case)
August 20 to September 16, 2023
|
The most common variants in
Ontario
were
EG.5.1.1 (14% and has decreased and is expected to stay the same),
EG.5.1 (8% and increased but expected to decrease), and
FL.1.5.1 (8% and increased and expected to decrease).
September 10 to 16, 2023
|
Source: Ontario Agency for Health Protection and Promotion (Public Health Ontario). Epidemiologic summary: SARS-CoV-2 whole genome sequencing in Ontario, October 3
, 2023. Toronto, ON: Queen’s Printer for Ontario; 2023.
COVID-19 Hospitalizations2,5
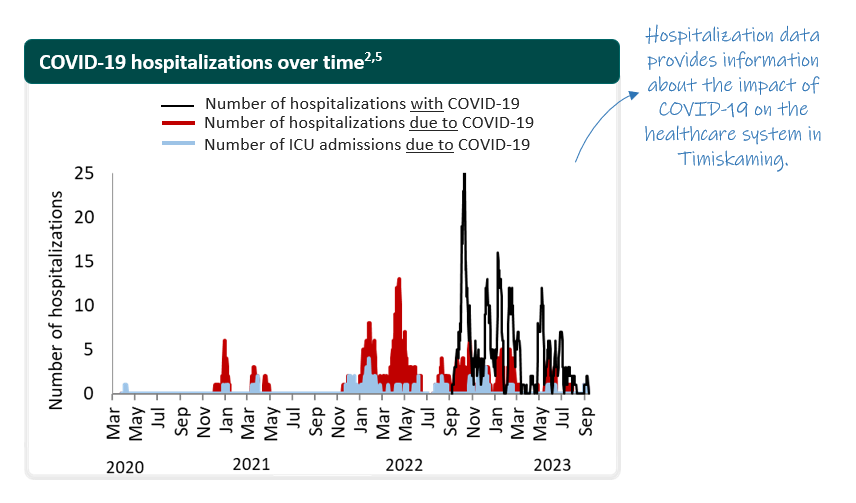
5 COVID-19 patients who are in the hospital while waiting to be transferred to long-term care are not included, except during a COVID-19 hospital outbreak.
Sources: Ministry of Ontario, Capacity Planning and Analytics Division, Visual Analytics Hub – Bed Census summary.
Data provided by local hospitals.
COVID-19 Deaths
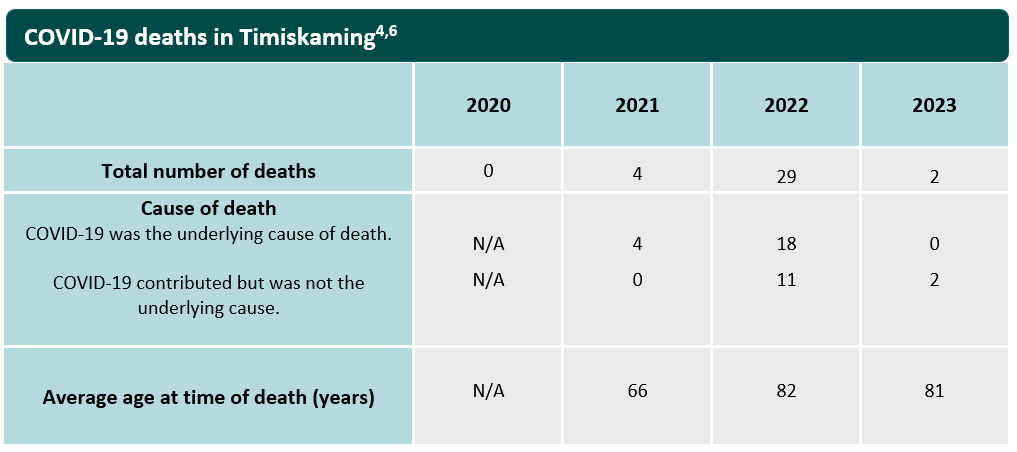
6 COVID-19 is not a contributing cause of death when there is a clear alternative cause, such as trauma, drug toxicity, or other natural death processes.
Wastewater Surveillance
Wastewater monitoring of COVID-19 in our communities
Timiskaming is monitoring local COVID-19 levels with a wastewater surveillance program, which involves testing sewage for the presence of COVID-19 in Kirkland Lake and Haileybury.
How it works
People with COVID-19 will have COVID-19 gene fragments in their stool, even if they don’t have symptoms yet or if they remain asymptomatic. That’s why testing wastewater can provide information about local COVID-19 levels. Wastewater data, along with other local COVID-19 indicators like case numbers and testing rates, can determine what steps are taken by public health to protect the public.
This type of testing is anonymous since it monitors the levels of the entire community at once.
How is sampling and testing done?
Several days a week, a sample is collected by the Ontario Clean Water Agency from the municipality’s wastewater treatment facility and sent to a laboratory, where it is tested for COVID-19 and COVID-19 variants. Results are shared with the Timiskaming Health Unit and can provide an early warning of an increase or decrease in local COVID-19 cases.
How to interpret the wastewater results
There are several factors that may affect the amount of virus detected in a wastewater sample. For instance, some samples froze while in transit to the lab during the winter months, and it is suspected that this decreased the amount of COVID-19 detected. Spring thaw or high levels of rain may also increase water in the sewage system and dilute the amount of COVID-19 detected. For these reasons, it is important to consider wastewater data with other COVID-19 data, such as case counts and hospitalizations.
Since the fall of 2022, the laboratory that analyzed Timiskaming’s wastewater samples changed from the National Microbiology Laboratory in Alberta to the Health Sciences North Research Institute in Sudbury. This change will decrease the shipping time between the wastewater plants and the laboratory for analysis.
Keep in mind that the case counts below are based on individuals getting tested for COVID-19 and that access to testing changes over time. For instance, as of Jan 1, 2022, the case count underestimates the number of people with COVID-19 in the communities.
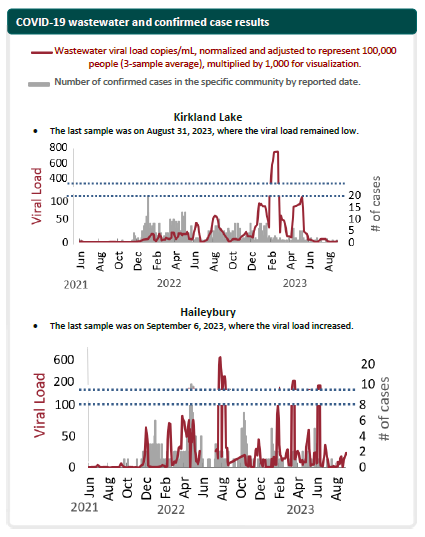
This project is run through a partnership between the municipalities of Kirkland Lake and Temiskaming Shores, the Ontario Clean Water Agency, the Government of Ontario, the Public Health Agency of Canada, Health Sciences North Research Institute, and the Timiskaming Health Unit. The program is funded through the Ontario Ministry of the Environment, Conservation and Parks. For more information, visit the Ontario government’s COVID-19 wastewater monitoring webpage.
20230801/cb:nd